Introduction
This webpage provides additional resources, links and content to support the Lunch and Learn held at the Department of Premier and Cabinet. Bryan and I appreciate that you’ve come here to learn more - if anything isn’t clear you can send me an email directly andrew@drandrewpratley.com
There are two types of resources on this page. Firstly, there are resources to support topics we covered in the Lunch and Learn (three types of questions) and secondly there are additional resources which we didn't have time for, but could be useful (where to find your data).
There’s over an an hour of video content on this page. It will stay live at this address until such time as the internet stops.
Slide deck
Click below to find a PDF of the slide deck used for Lunch and Learn
Finding your data
Your data is can usually be found in (i) your systems (ii) your customers or (iii) your staff. In the video below I describe how when we look at our systems we’re often looking back into our history., when we speak to our customers we learn about the present, but when we work with our internal experts (staff) that’s where the real opportunity is.
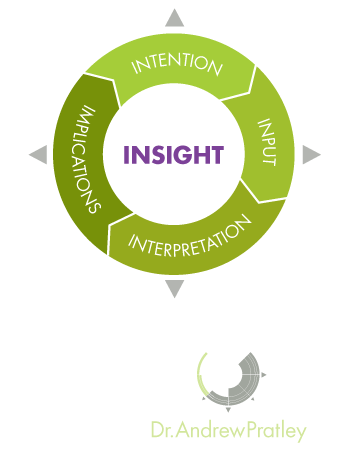
Smarter Data
The Smarter Data model is a structured way to think about solving problems. The model is useful for working through novel problems as each step informs the next, including the implications of the first round informing the intentions of the second round.
Intentions - This is what you want to achieve. A good intention is clear and links to one of the three types of problems.
Inputs - This is the data set needed for the intention. This may either be data you already have access to, or data that you need to collect.
Interpretation - This is the statistical test or visualisation (graph) you'll run to analyse the data from the input. This will usually be either (i) calculating probability (ii) testing for differences or (iii) measuring a relationship.
Implications - This is the conclusion you draw for the business. The implications often requires further analysis or investigation.
The video above is a quick overview of the four components of the Smarter Data model. Intention, Inputs, Interpretation and Implications. The Smarter Data model works both both looking at the item before and the item after the current point of focus.
An overview of the three types of problems

Broadly speaking there are three types of data problems. There are problems that involve counting the number of outcomes (probability). There are problems that involve making a decision between two different situations (differences). There are also problems that involve how two or more variables relate to each other (relationships).
Probability - When you're trying to assess how likely an outcome is compared to an expectation, probability is usually the right approach. The classic probability problem involves drawing coloured balls from a bag, or the chance of rolling a certain set of faces on dies. To solve a probability problem you need to be able to calculate the chance of possible outcomes and ensure these equal to one.
The most useful application of probability is the binomial distribution. This is the distribution used when there are only two possible outcomes (a sale or no sale), the chance of success is constant (always 20% chance of a sale), the number of trails is fixed (30 phone calls per day), and the result of one trial doesn't influence the next trial (just because one person buys doesn't influence the next person).
Differences - When you have two (or more) possible approaches testing to see if there is a difference is usually the right approach. Testing differences asks the question whether the mean (average) of one data set is far enough away from the mean of another data set to state they are different. To run a test of differences you'll need to set a level to draw this conclusion (use alpha = 0.05).
The most useful application of differences is the t-test. This is the test of whether the distribution of one average is different to another distribution of an average. To form the distribution of these averages individual data is collected. These distributions are called sampling distributions (of the mean) and are different to distributions of individual data as they use the standard error instead of the standard deviation. The standard error is result of the standard deviation divided by the square root of the sample size (n). To use a t-test you'll need samples of 30 or more to meet normality requirements. An example of testing differences might be to assess whether a change in the layout of the shop results in increased sales.
Relationships - When you have multiple measures on one item you can determine if there is a relationship. When assessing relationships you need to have a data set which links different measures across individuals, locations or time. A relationship doesn't necessarily imply causation, it simply shows correlation. Causation (A caused B) is surprisingly difficult to 'prove'.
The most useful application of relationships is (simple) linear regression. Simple linear regression is the measure of the strength of a linear (straight line) relationship between two variables or measures. This is usually plotted on a graph of a series of x-y points with the line of best fit determined by mathematics. There are number of ways to interpret simple linear regression models. The two values of most interest are the r-squared value and the coefficient of the slope. The r-squared value tells you how much of the variation in y is predicted by x. The coefficient of the slope tells you for a one unit increase in x what the change in y will be. E.g you might develop a simple linear regression model based o the amount of revenue of an event and post event online sales. If there was a strong linear trend with r-squared = 0.8 then we could 80% of the online sales are determined by the revenue of the event. The other 20% could come from online advertising or other factors. If the coefficient of the slope was 0.3 then we could conclude that on average for each dollar spent at the event $0.3 dollars will be spent on the post event online sales.
How to increase sales and cut costs
In the below video, I look at the most common question leaders have - how to double or triple your sales. Doubling or tripling sales is a very large problem to deal with by itself. I discuss how by breaking down the how to increase sales into as (i) probability (ii) differences and (iii) relationships problems how you can use small questions to increase your sales.
In the video below I discuss the topic leaders next want to know about - how to cut costs. I discuss how you can look at questions surrounding (i) probability (ii) differences and (iii) relationships to cut costs in your business. I discuss how you won't always be able to cut costs in one step, but by adopting the right mindset, you will be able to cut costs significantly.
The video above is short overview of the three types of problems that can be solved with statistics and identifies the key features and an example of each. The three types of problems are: (i) probability (ii) testing differences and (iii) relationships.
Data checklist
The two things you must do for all your questions is ensure your data is (i) verified and correct (ii) Is your range appropriate. In the video below I explore these criteria as well as what your data needs to look like to ask either a probability, difference or relationship question.
Examples of the three types of problems dealing with sales questions
In the video below I discuss how to assess the chance of success per sales using probability. I discuss what the distribution of successful sales calls looks like and the implications this can have for your business.
In the video below I discuss how to assess the difference between two sales models by comparing the revenue between commission and non-commission based sales models. Using the the Smarter Data model I show you how to systematically step through this problem and apply the steps to any differences question. I discuss the importance of (i)having each group be randomly selected (ii) Ensuring each sample size is at least 30 and (iii) thinking through how to interpret data properly.
In the video below I use the Smarter Data model to examine whether additional sales staff increase profits. I discuss how to interpret your graphs to understand your data, and what statistical tricks you can use to smooth your data.